
The PowerShell Universal Dashboard is one of the coolest PowerShell modules available right now. It allows IT Pro’s to stand up beautiful Web UI dashboards with just a few lines of PowerShell. It’s very easy to get started and if you want to learn the basics on creating a simple dashboard, be sure to check out one of my previous posts “Building PowerShell Tools for MSPs – PowerShell Universal Dashboard“. I’m going to go more in-depth and explain how you can get started with creating your own Dashboard for an ESXi environment and I’ll be sharing the current state of our ESXi Dashboard project on Github so you can contribute as well. The final vision of this dashboard is to create a tool that allows VMware Administrators to quickly look through information on their environment that they would otherwise have trouble doing so with the native vSphere toolset:

PowerShell Dashboard for ESXi Requirements
This dashboard can be run almost anywhere, IIS, container, PowerShell console, or as a Windows Service. The only requirement is that we will need two PowerShell modules installed on the endpoint that is going to run the dashboard. First, we will need the latest version of the Universal PowerShell Dashboard. So if you don’t already have it, open an administrative PowerShell console and run the following command:
Install-Module -Name UniversalDashboard
Next, we will need the PowerCLI module installed in order for our dashboard to connect to a vCenter instance. If it’s not already installed on your endpoint run this command:
Install-Module -Name VMware.PowerCLI
Note: This dashboard is making use of some features of the Universal Powershell Dashboard module that require a license. As of right now, the licensing cost is only $100 a year which is a STEAL. You may run this dashboard without licensing it, however, the only caveat is that the dashboard will shut down every hour and you will need to restart the service.
Handling Login Authorization with ESXi and Our Dashboard
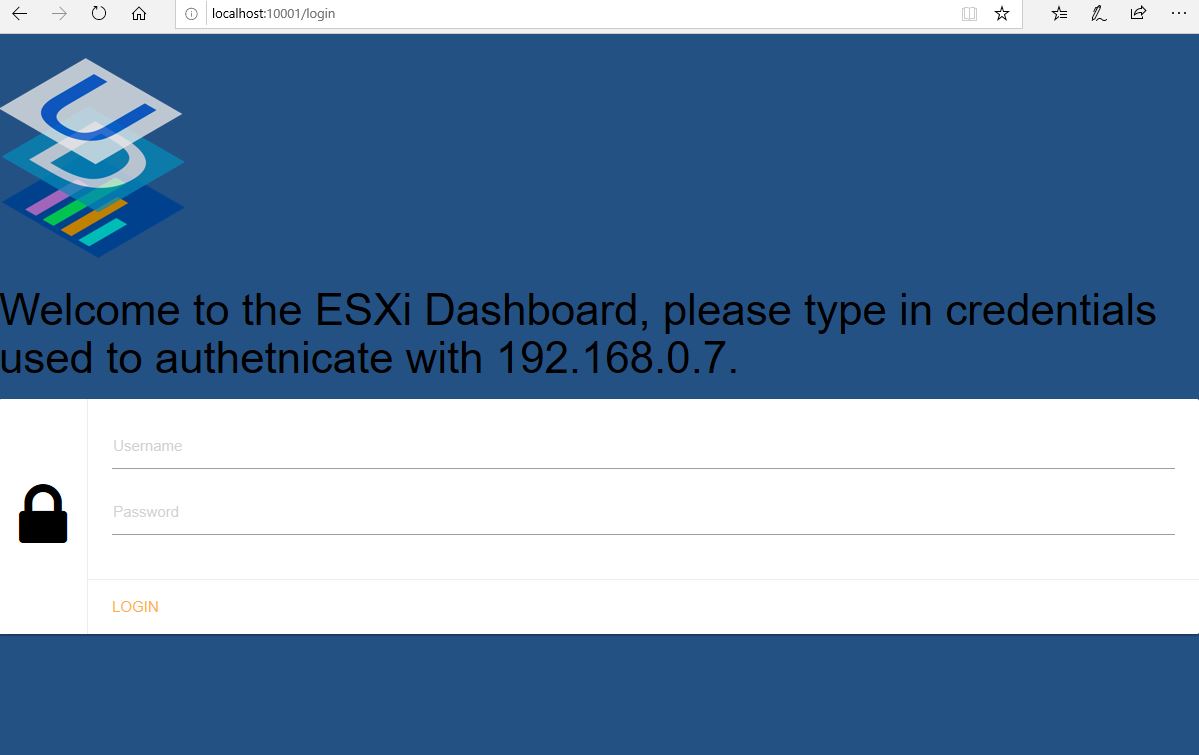
The dashboard login is how we are going to establish a connection to vCenter and call that connection throughout the pages. The credentials that we use to login to the dashboard must pass authentication with. Let’s review the code. We set up our method for authenticating first, we are using a “Form Login” which is the process the Universal Dashboard gives us for customizing what we are authenticating against. Also, make sure to edit the vCenter address to match your environment. We test the login credentials that we input on the dashboard login page against the vCenter address using Connect-VIServer. If the connection is successful, we save that vCenter session as a “cached variable” which in the Universal Dashboard is a variable that gets saved into memory and can be called upon from other pages. We will use this variable to call our connection from vCenter in order to run PowerCLI commands on other pages without having to log in again. Lastly, if the test connection to vCenter is successful we redirect the page to the home page of the dashboard using New-UDAuthenticationResult with the -success parameter:
#Authentication
$FormLogin = New-UDAuthenticationMethod -Endpoint {
param([PSCredential]$Credentials)

#edit this to change VCenter server address
$Vcenter = "192.168.0.7"

$ESXiConnectionTest = Connect-VIServer -server $Vcenter -Credential $Credentials -NotDefault

if ($ESXiConnectionTest.IsConnected -eq 'True')
{
$cache:VCSession = Connect-VIServer -server $Vcenter -Credential $Credentials -NotDefault
New-UDAuthenticationResult -Success -username $Credentials.UserName
}


New-UDAuthenticationResult -ErrorMessage "Your Credentials were not able to authenticate with $VCenter."

}
Next, we will set up our pages. We create the login page and include our variable for the “authentication method” that we planned out above. Then we lay out what pages we want to include in the dashboard. I have each page broken down into its own .ps1 file. This allows for an easier organization:
Lastly, we have cmdlets used to create and start our dashboard, I have all the page variables listed out in an organized format:
#Login Page
$LoginPage = New-UDLoginPage -AuthenticationMethod $FormLogin -WelcomeText "Welcome to the ESXi Dashboard, please type in credentials used to authenticate with $VCenter."


#Pages
$HomePage = . (Join-Path $PSScriptRoot "pages\home.ps1")
$HostsPage = . (Join-Path $PSScriptRoot "pages\hosts.ps1")
$VMspage = . (Join-Path $PSScriptRoot "pages\vms.ps1")


#Starting the Dashboard
Get-UDDashboard | Stop-UDDashboard

Start-UDDashboard -Content {
    New-UDDashboard -Title "ESXi Dashboard" -LoginPage $LoginPage -Pages @(
        $HomePage,
        $hostspage,
        $VMspage
    )
} -Port 10001 -AllowHttpForLogin
Connecting to vCenter on Each Page
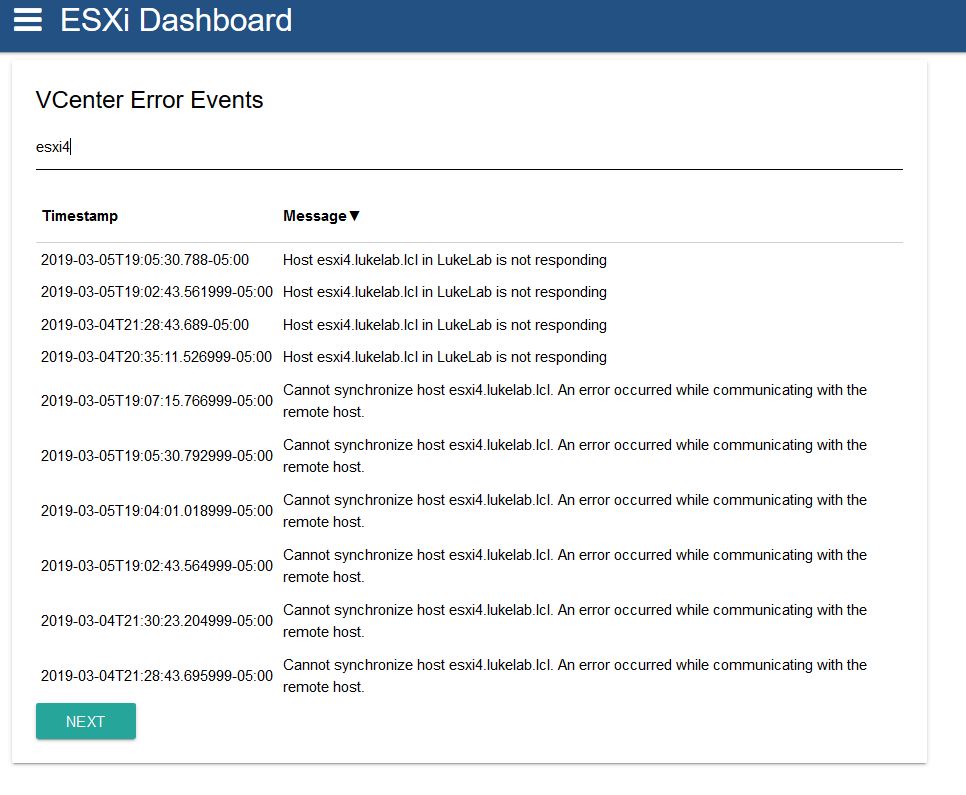
I’ve made 3 pages so far as a start for this dashboard. For each page, when we use a PowerCLI cmdlet to grab information from VCenter, we will use the -Server parameter and the $cache:VCSession variable to call our vCenter session. Take a look at the syntax for the home page, it is configured to display recent error messages in VCenter. We use Get-VIEvent to grab this info from vCenter:
New-UDPage -Name "Home" -Icon home -Content {
    New-UdRow {
            New-UdColumn -Size 6 -Content {
                New-UdRow {
                    New-UdColumn -Size 12 -Content {
                            #new grid for all VCenter events
                            New-UDGrid -Title "VCenter Error Events"  -Headers @("Timestamp", "Message") -Properties @("CreatedTime", "FullFormattedMessage") -Endpoint {

                                Get-VIEvent -Server $cache:VCSession -MaxSamples 15 -types error| select CreatedTime,FullFormattedMessage | Out-UDGridData

                            } -AutoRefresh -RefreshInterval 60 -FontColor "black"

                    }
                }
            }
        }

}
This is called a “grid” in the Universal Dashboard and can be used to filter out information in a table. I can pull up all error event’s that have the word “esxi4” in them:
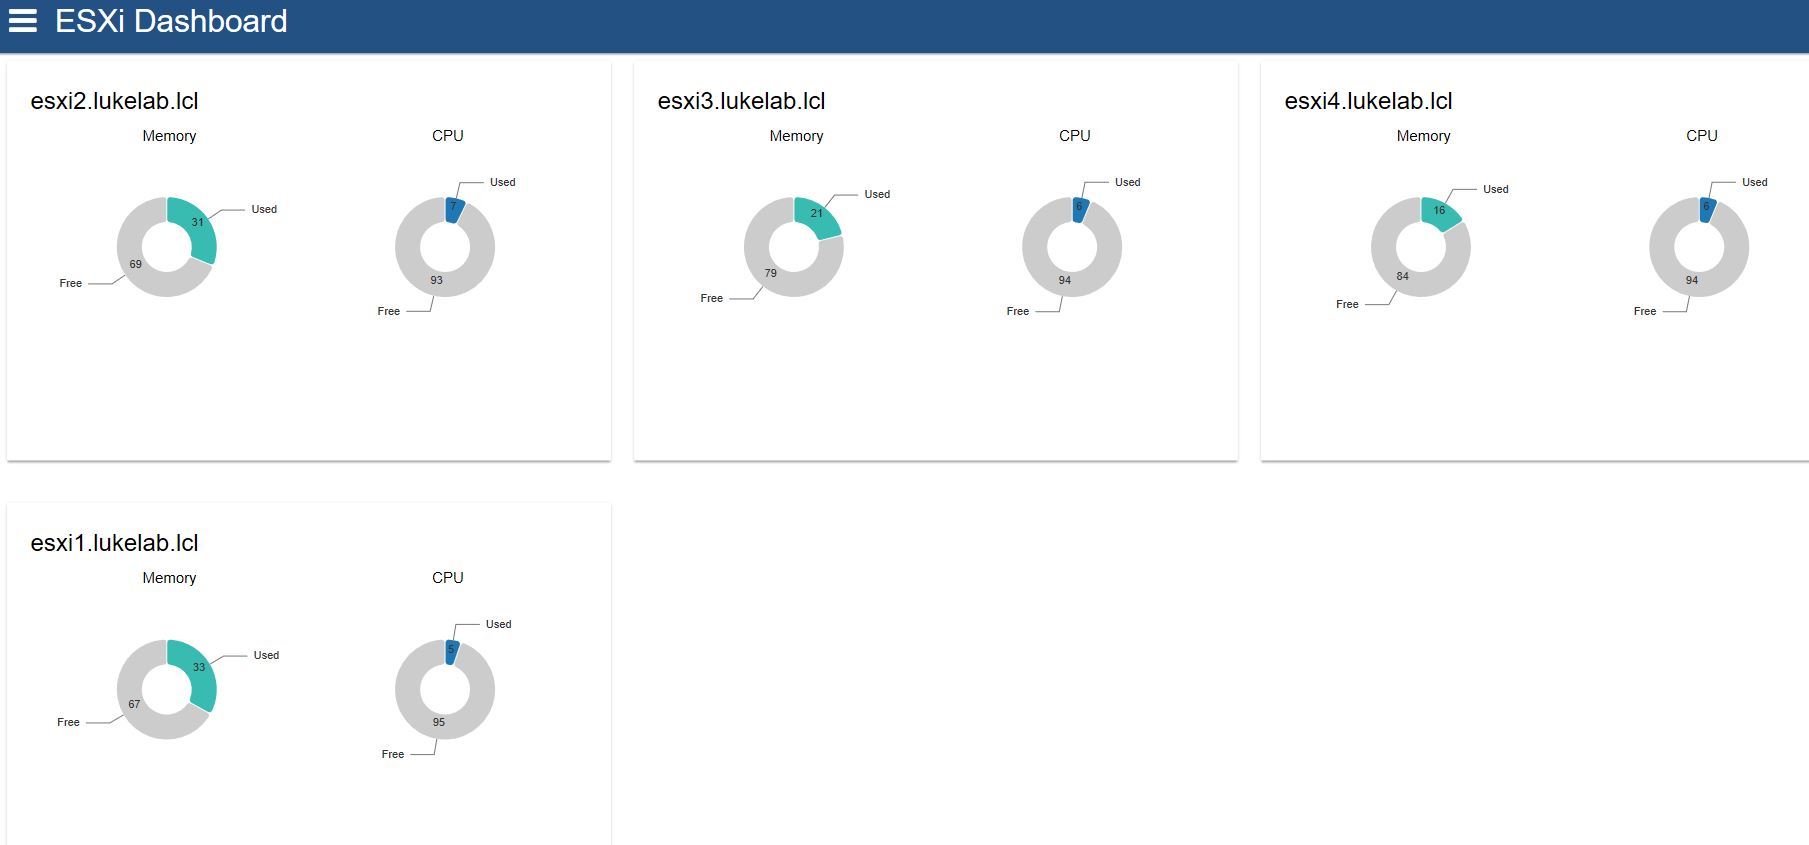
My last two pages that I’ve created so far are memory and CPU monitors for each VM or Host that is in vCenter. So when each page loads, it will grab all available VMs or Hosts and provide a pie chart of their respective memory and CPU stats:
How To Set Up Your ESXi Dashboard
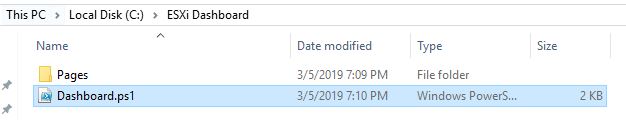
You can set up this dashboard by downloading the directory from our Github page. If we want to run this as a windows server on an endpoint, make sure the required modules as posted above are installed on that endpoint. Then copy the files to a folder:
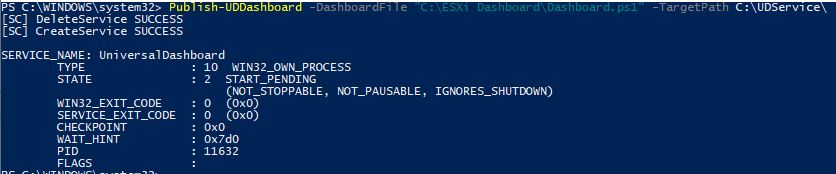
Create another folder to run the service from that location. I chose “C:\UDService”. We will need to copy our pages folder to that location as well but not the Dashboard.ps1, that will come over when we run our command. We will open up an administrative command prompt and use the Publish-UDDashboard cmdlet and specify the current location of our dashboard.ps1 file and the folder we want to run the service components from. The dashboard.ps1 file will be copied there as well:
Publish-UDDashboard -dashboardfile “C:\ESXi Dashboard\Dashboard.ps1” -TargetPath c:\udservice\
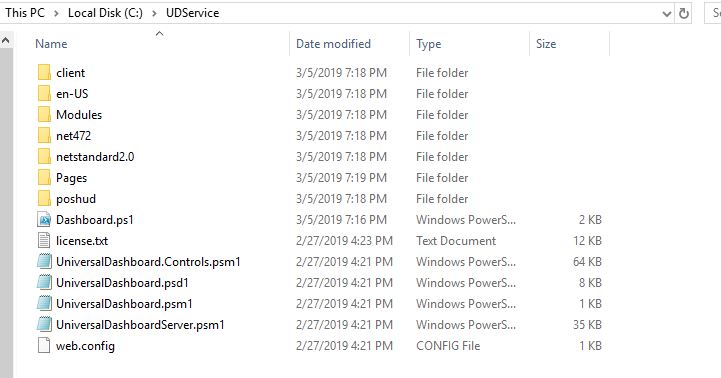
When we look in our service folder, we can see all the module components are copied over as well as our dashboard.ps1 file:
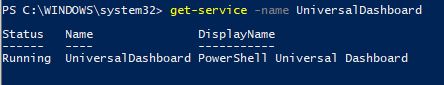
If we run get-service and the UniversalDashboard name we can verify that the newly configured windows service is now running:
On the endpoint where the service is installed, go to http:\\localhost:10001 and you will get to the Web UI of the dashboard. Don’t forget to edit the vCenter address in the dashboard.ps1 file. Also, I highly recommend setting up the dashboard to use a certificate and run it over https, check out the instructions here. Since this is a project now on GitHub, I will be making modifications and adding more and more features to this dashboard. Feel free to contribute as well, that’s the beauty of GitHub. Also, let me know in the comments below of any features you would like to see in a dashboard for managing ESXi and I’ll try to add them in.
[the_ad id=”4738″][thrive_leads id=’18673′]
More in this category


About the Author

Luke Orellana

